Introducing Barr Data Visualizer: Leverage the power of your data

In today’s fast-paced, data-driven world, project owners who have access to up-to-date, actionable insights protect their investments by planning, staying informed, and adapting to changing conditions. Barr Data Visualizer (BarrDV) is a powerful new tool developed to serve clients with individually defined, and at times complex, data needs. In addition to visualizing near-real-time data through fully customized parameters and dashboards, our clients gain access to our extensive, anonymized, proprietary dataset—viewed in the context of their own challenges. This completely transforms how our clients leverage their data. Take these common challenges, for example:
-
Need to compile data from numerous sources, like lab reports, historical documents, and various databases? BarrDV seamlessly consolidates this data, enabling investigation of results and analysis of trends that would otherwise be hidden.
-
Struggling to stay on top of continuous sampling requirements? BarrDV can process this data and automatically issue alerts when regulatory requirements are at risk of exceedance.
-
Trying to keep up with ongoing operation and maintenance tasks? BarrDV can track qualitative information alongside quantitative data, allowing projects to monitor equipment performance and trigger maintenance when needed.
BarrDV is built to tackle all these challenges and more: bringing your data together, increasing accessibility, keeping it secure, and delivering the insights you need.
What is BarrDV?
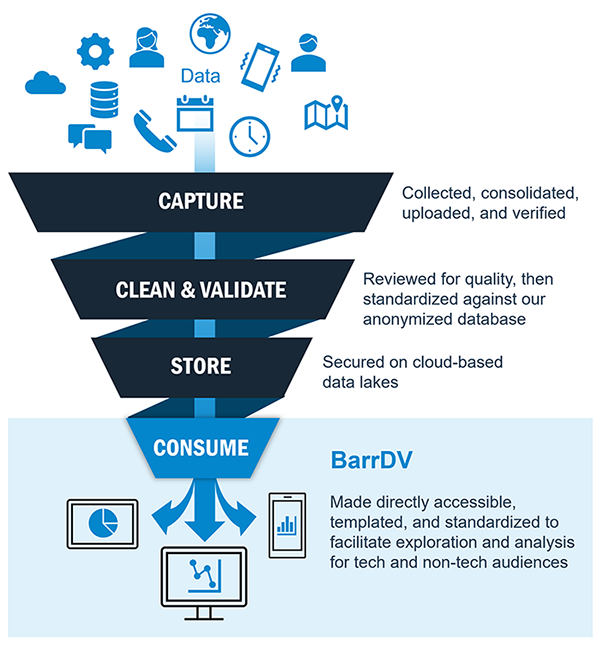
BarrDV brings your data together, increases accessibility, keeps it secure, and delivers the insights you need.
BarrDV is a dynamic platform containing powerful templates customized for each project’s unique needs. This tailored experience empowers both technical and non-technical audiences to monitor conditions through intuitive, dynamic visualizations on the front end while granting access to deep datasets on the back end. This is accomplished through coordinated data connections that can be reconfigured as users learn from the data and their project needs evolve.
By systematically synthesizing, analyzing, and visualizing large amounts of quantitative and qualitative information from diverse sources such as EQuIS, GIS, and Microsoft SharePoint, BarrDV delivers insights in a clear, digestible format. It transforms raw data into interactive charts, figures, maps, and tables, which are fully filterable, easily exportable, and automatically updated as new data is uploaded and validated. End users can directly access, explore, and analyze their own data. Gone are the days of static charts, figures, maps, and tables.
Why choose BarrDV?
BarrDV offers more than just the tangible benefits of its power as a data access, analysis, and visualization tool; it also allows you to leverage the intangible value of Barr’s extensive expertise in environmental data management. Additional benefits are summarized below.
- Enhancements benefit all users: Each BarrDV project is built using a similar template that evolves through lessons learned. Improvements to BarrDV benefit all users, with costs shared across all projects.
- Familiar platform: BarrDV is built on Microsoft Power BI and the familiar Microsoft Office ecosystem.
You’ll be in control:
- Dynamic filtering: Interactive filters allow deeper exploration of the data in BarrDV.
- Export capabilities: Based on client-driven parameters, end users can export the data for reporting or for more advanced analysis using other tools (e.g., statistical and hydrologic modeling software, GIS, etc.).
- Flexible access settings: BarrDV is accessible from almost any internet-connected device.
You’ll find built-in data integrity, integration, and security:
- Owner-defined access: Access is limited to those who are explicitly granted permission to view the datasets. Microsoft security is used to manage and control user access, and users can log in using their existing Microsoft credentials.
- Support across diverse data sources: Data from EQuIS, GIS, Microsoft SharePoint, SQL, and more can be integrated into BarrDV applications.
- Secure, direct connections: BarrDV data is stored in secure, cloud-based data lakes.
You can do more with your data:
- Dynamic, interactive experience: Move beyond the limits of traditional static data-driven deliverables to responsive and engaging data tools.
- Faster decision-making: Near real-time access to data, automated analysis, and visualization allow for more rapid responses as new information is available.
- An eye toward the future: BarrDV is designed to integrate with AI as new tools become available.
Are you ready to speed up your data-driven decision-making?
Barr’s data management team has produced BarrDV applications for over 50 projects for clients who require real-time access to their data. Contact us to discover how your organization can be empowered by a direct connection to your data as it is collected.
About the authors
As a data management technician, Matthias Wolf brings over eight years of experience in environmental data management, visualization, and analysis to a wide range of projects. Leveraging his expertise in EQuIS and Power BI, he has developed customized BarrDV applications for projects across several business units and market sectors.
Erin Dietrich, senior data management specialist, is an expert in environmental data systems integration, workflow optimization, and process standardization. She specializes in developing scalable solutions that seamlessly connect analytical tools and databases—enhancing data quality, efficiency, and accessibility across diverse projects. With deep expertise in platforms such as Power BI, Power Apps, EQuIS, SQL, SharePoint, and Excel, Erin has played a pivotal role over the last decade in advancing Barr’s environmental data management program. Her leadership has been instrumental in establishing company-wide standards, documentation, and best practices that promote consistency and transparency in data handling.